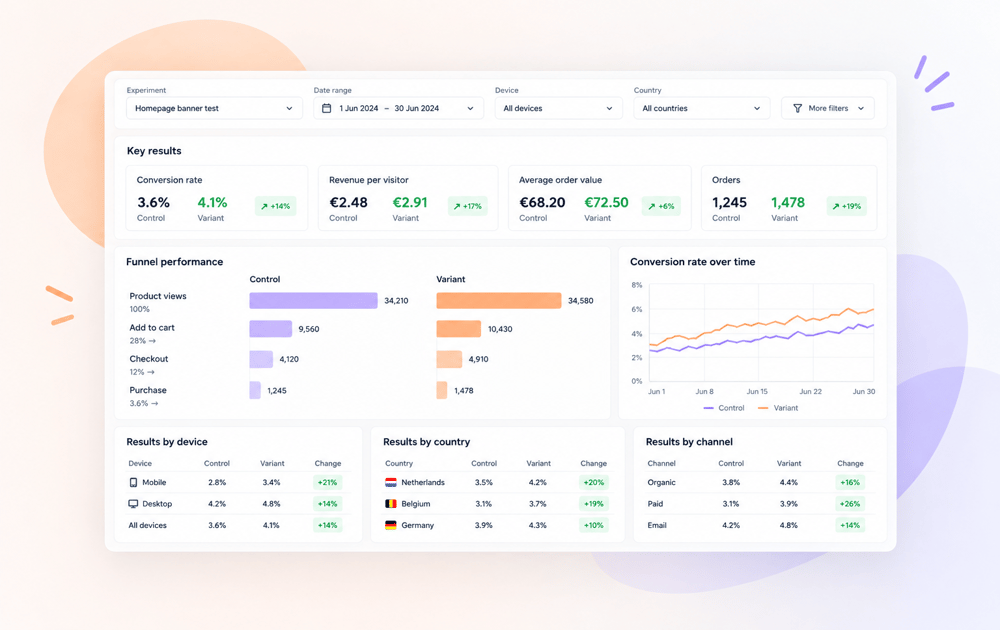
Running an A/B test is only part of the experimentation process. Once a test has finished, a significant amount of work still needs to happen before the results can actually be evaluated.
For every experiment, the full evaluation process agreed with the client needs to be followed. This means collecting the right data for each step of the funnel, analysing key metrics such as conversion, revenue and Average Order Value, applying the correct segments and exclusions, and handling outliers consistently.
Depending on the experiment, this analysis may also need to be repeated across mobile and desktop, different countries, channels or visitor groups. All of that data then needs to be checked and brought together before the actual interpretation can begin.
None of these steps are particularly difficult on their own. The challenge is that they have to be repeated for every experiment. Doing this manually takes a considerable amount of time and also makes the process more prone to mistakes and inconsistencies. A different filter, an incorrectly selected segment or a missed step can easily affect the outcome of an evaluation.
And as the number of experiments grows, so does the amount of repetitive work.
That was the main reason for building our experiment reporting tool: to automate as much of this manual and error-prone preparation as possible, while keeping the evaluation methodology consistent.
A simpler way to evaluate experiments
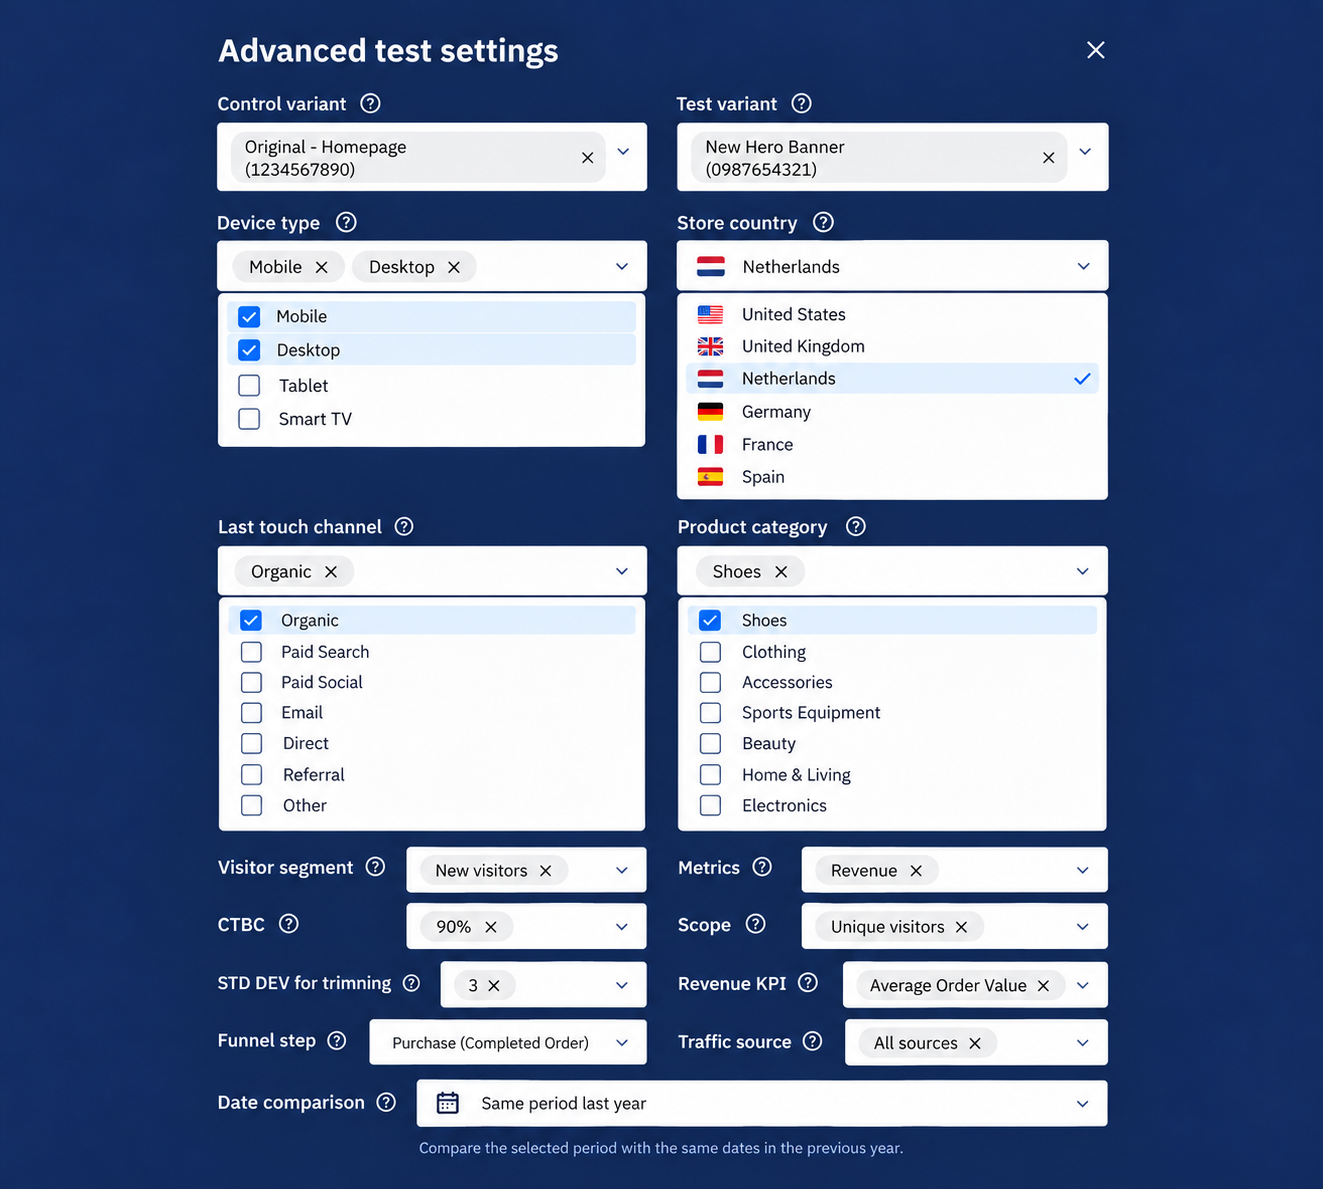
The tool brings the different steps of the reporting process together in one place. You select the experiment, choose the date range, and decide whether you want to look at mobile, desktop or all devices. The tool then automatically gathers the relevant data and presents it in one structured overview.
Most of the setup is already done for you. The tool starts with the standard approach agreed with the client, meaning the usual metrics, countries and filters are already selected. For most experiments, these defaults can simply be used as they are.
If a test requires a different setup, you only need to adjust what is relevant. You can, for example, choose which version is the control and which is the variant, select specific countries, or narrow the analysis down by product category, channel or visitor group.
One view of the experiment
The resulting report brings together performance across the funnel as well as commercial metrics such as revenue and Average Order Value in one overview.
This gives a more complete picture than looking at conversion alone. An experiment may affect a specific part of the funnel, perform differently for a certain segment, or have an impact on order value that would otherwise be easy to miss.
Because data collection and reporting are largely automated, more time can be spent on understanding what actually happened instead of preparing the report.
More time for the part that matters
The tool does not replace the evaluation itself. The value still comes from interpreting the results, understanding why behaviour changed and deciding what can be learned from the experiment.
By automating much of the repetitive work that comes before that point, the tool makes the evaluation process more efficient.
The result is a process that is faster, more consistent and less error-prone, leaving more time to focus on the insights that can improve future experiments and decisions.
Want to know how a smarter experiment reporting process can help you save time, reduce errors and focus on what the results actually mean? Give us a shout!